Register | Sign In


Understanding through Discussion


EvC Forum active members: 59 (9164 total)
4 online now:
Newest Member: ChatGPT
Post Volume: Total: 916,923 Year: 4,180/9,624 Month: 1,051/974 Week: 10/368 Day: 10/11 Hour: 1/2


Thread  Details

Email This Thread
Newer Topic | Older Topic
  
Author Topic:   Eco-Guilt
roxrkool
Member (Idle past 1019 days)
Posts: 1497
From: Nevada
Joined: 03-23-2003


Message 16 of 67 (512779)
06-20-2009 9:59 PM


What a relief!
I just wanted to say what a relief it is to read about others' skepticism regarding AGW. These days, I've learned to keep my mouth shut on this issue because I'm tired of being labeled a "crackpot anti-science denier." lol
It's not that I don't think it's possible, I simply require more substantive proof that all these current phenomena (e.g., melting glaciers, animal extinctions, rising sea levels, etc.) are the result of AGW. Although to be honest, that may in fact be very difficult since as a geologist who is trained to think in terms of multi thousands to millions to billions of years, it's very hard for me to understand how scientists today can separate the effects of 20,000 years worth of natural warming from 200 years worth of human-caused warming.
Global warming IS happening. It has been happening for something like 20,000 years. Animals have been going extinct since the last ice age, the glaciers have all been melting since the last ice age, oceans have been rising since the last ice age. Have these sorts of events been accelerating? Perhaps, but without hard or direct data/evidence in support of this, there's a lot of room to manipulate the indirect data in your favor.
I suppose what really has been grating on my nerves is that the AGW crowd is demanding I accept their interpretation of the data. I don't like that. That sort of bullying results in me digging in my heels and asking, "why?"

Replies to this message:
 Message 17 by Hyroglyphx, posted 06-20-2009 10:48 PM roxrkool has not replied

  
roxrkool
Member (Idle past 1019 days)
Posts: 1497
From: Nevada
Joined: 03-23-2003


Message 20 of 67 (512790)
06-21-2009 2:20 AM
Reply to: Message 18 by Nuggin
06-20-2009 11:07 PM


Re: Correlation causes retardation apparently
Ditto the fact that the Earth is heating up. Ditto the fact that it's heating up during a time of reduced solar activity.
So, we are getting LESS heat from the Sun and still increasing in temp. We are doing this while simulateously increasing gas levels which we KNOW trap heat.
And yet that's not evidence enough for you.
See, this is the stuff that gets me confused. Based on the graphs below (using proxy data), I would think your above statements are in error. It appears to me that solar radiation has in fact been fairly high for the last 300 years or so. Am I reading the graphs incorrectly, perhaps? Or maybe I'm missing some important fact?
Either way, I have no argument against cleaning up our atmosphere and pursuing greener technologies. It certainly would be healthier for the planet in general, and humans in particular.
Edited by Adminnemooseus, : Make graphs into thumbnails (thumb=600).

This message is a reply to:
 Message 18 by Nuggin, posted 06-20-2009 11:07 PM Nuggin has replied

Replies to this message:
 Message 25 by fgarb, posted 06-21-2009 6:10 AM roxrkool has replied
 Message 30 by Nuggin, posted 06-21-2009 10:47 AM roxrkool has not replied

  
roxrkool
Member (Idle past 1019 days)
Posts: 1497
From: Nevada
Joined: 03-23-2003


Message 21 of 67 (512791)
06-21-2009 2:52 AM
Reply to: Message 19 by Nuggin
06-20-2009 11:13 PM


Re: What a relief!
Global Temps are increasing at a FASTER RATE than they have in the past. THAT'S IMPORTANT INFORMATION.
I completely agree. Changes in rates are extremely noteworthy. But what is the time-scale you are considering?
Temps are increasing at a faster rate since when? In the last ten years? Fifty years? Three hundred years? A million years? Ever?? That would be a pretty bold statement considering the age of the earth.
Just stating that temps are increasing at a faster rate is meaningless without providing a context. Especially since we're not even 100% sure we understand the cause of all the other temp spikes during Earth's long history.
It also bothers me to compare real-time data, that we have collected using modern (or fairly modern) instrumentation, to proxy data. Much of the proxy CO2/Temp data came from where? Rocks, ice cores, etc., correct? How do we know at what detail those data (i.e., conditions) were preserved? Isn't it possible that we are looking at 'smoothed' data or snapshots of the actual conditions of the time? Maybe what's preserved are all the highs... or all the lows... or suffered the effects of... equilibrium(?).
(I'm getting out of my league here. lol)
To me, it's a bit like examining precipitation data. Looking at one day's worth or even one month's worth of precipitation data is not necessarily representative of the year in which the data occur and most certainly not representative of years before or after. Hell, you can't even use these data to predict what it's going to do in varying topographical regions of the same valley from year to year.
If I am viewing this wrongly, please explain. I would really like to know what I'm missing.

This message is a reply to:
 Message 19 by Nuggin, posted 06-20-2009 11:13 PM Nuggin has not replied

Replies to this message:
 Message 22 by Legend, posted 06-21-2009 4:54 AM roxrkool has not replied
 Message 26 by Minnemooseus, posted 06-21-2009 6:22 AM roxrkool has replied

  
roxrkool
Member (Idle past 1019 days)
Posts: 1497
From: Nevada
Joined: 03-23-2003


Message 33 of 67 (512830)
06-21-2009 12:39 PM
Reply to: Message 25 by fgarb
06-21-2009 6:10 AM


Re: Correlation causes retardation apparently
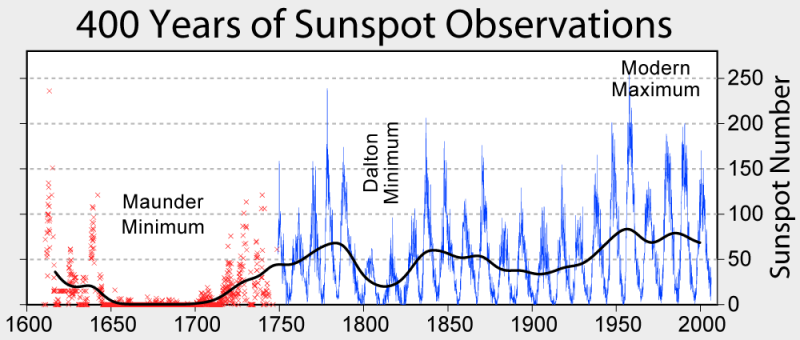
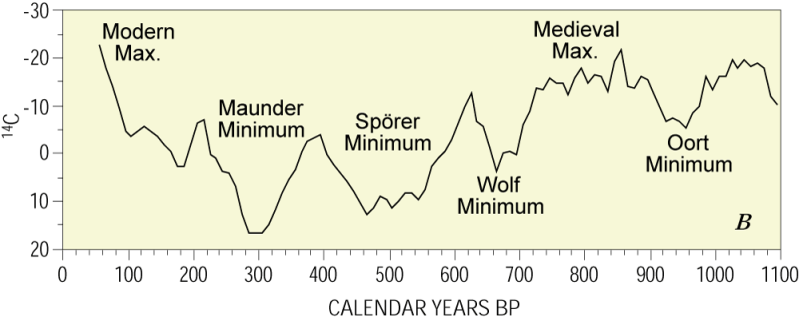
As your own graph above shows, sunspots are a component of solar variation, which itself results from changes in solar radiation. So it's not really that unimportant, I don't think. And the 14C graph (which you did not mention) is also considered a proxy for solar activity.
As far as I know, solar activity is a significant contributor to climate change.
It is true that the solar irradiance is very slightly higher now than it was 300 years ago, however I am skeptical that this explains the rising temperatures. a) The IPCC would have to have really screwed the pooch on this one if they were off by 10 sigmas or so in their uncertainties on the relevance of this effect, and b) you can directly see that in the last 30 years temperatures have continued to rise while the solar output has remained constant.
I have learned not to discount any possibility or place complete trust in the integrity/validity of data compiled, manipulated, and anylyzed by any other scientist. Obviously, we are forced to trust other people's work on many occasions, but I am always skeptical of data I have not personally analyzed.
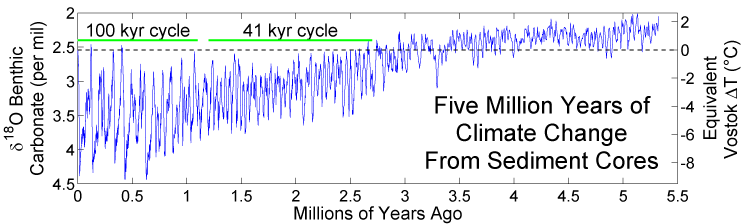
In addition, I know it's hard for some to understand, by I simply cannot accept and draw any conclusions from 30 years worth of data. That is an exercise in futility, as far as I'm concerned. Perhaps that is not your intention.
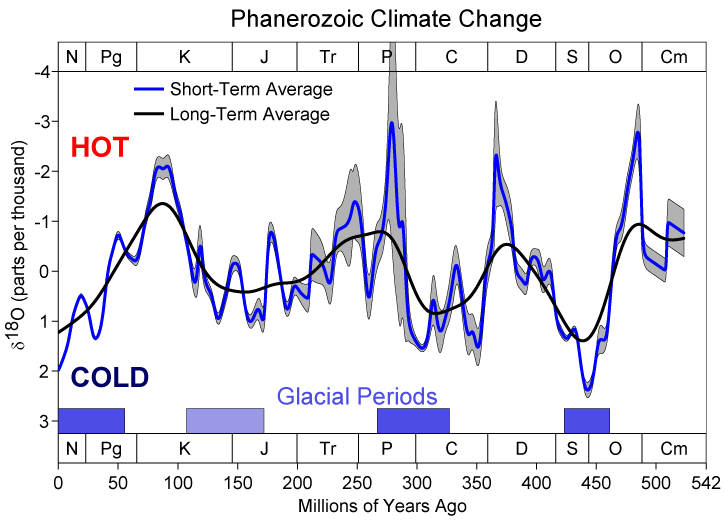
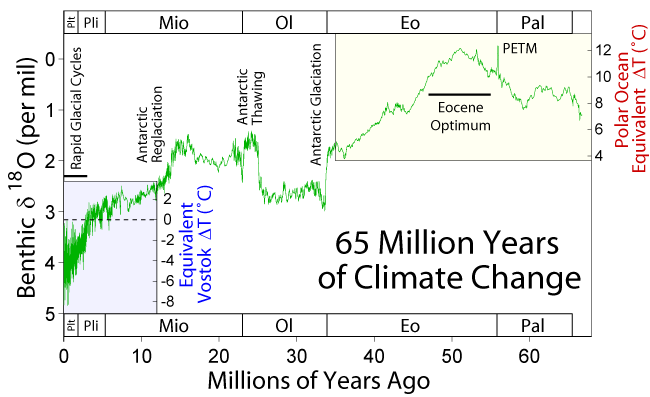
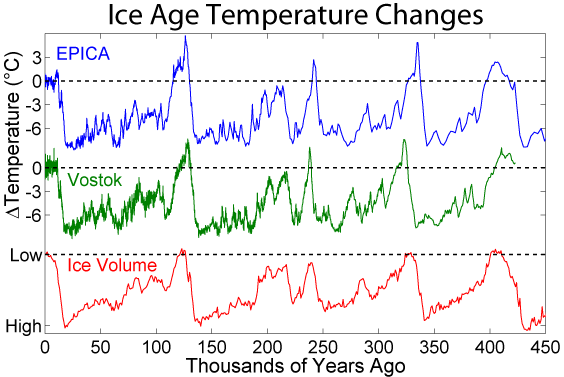
What do those graphs look like when displaying several hundred to thousand years worth of data?
There would have to be some very slow feedback effect in place for ancient solar variations to be causing modern temperature rises.
And is this not possible in your opinion?

This message is a reply to:
 Message 25 by fgarb, posted 06-21-2009 6:10 AM fgarb has replied

Replies to this message:
 Message 38 by fgarb, posted 06-21-2009 1:07 PM roxrkool has not replied

  
roxrkool
Member (Idle past 1019 days)
Posts: 1497
From: Nevada
Joined: 03-23-2003


Message 36 of 67 (512833)
06-21-2009 12:47 PM
Reply to: Message 26 by Minnemooseus
06-21-2009 6:22 AM


Re: Paleothermometry
I'm glad you posted that and not me. lol
Thanks, I do remember that now. That site had some great graphs that I'll be posting in a bit.

This message is a reply to:
 Message 26 by Minnemooseus, posted 06-21-2009 6:22 AM Minnemooseus has not replied

  
roxrkool
Member (Idle past 1019 days)
Posts: 1497
From: Nevada
Joined: 03-23-2003


Message 41 of 67 (512844)
06-21-2009 2:26 PM


Let's look at all sorts of temperature graphs...
These sorts of data are why I am so skeptical at the moment. Just off the top of my head, these data tell me that:
1. Global temperatures have been decreasing in general over the last 80 million years since about the Late Cretaceous, with two warming periods during the Eocene (@ ~50 mya) and Miocene (@ ~20 mya).
2. Temperature variations increase dramatically with proximity to modern times. Telling me that the integrity of the data is compromised with increasing age. This is evident in the middle three graphs. I believe this results in a 'smoothing' of the data so that we are actually losing the highs and lows. The begs me to ask, at what point in time does the loss of integrity in the proxy dataset begin?
3. Arctic (and global?) temperatures have been on the rise for approximately the last 15 to 18 thousand years. Today, we are actually cooler than previous warming periods. That's not relevant to AGW, but perhaps noteworthy.
4. In the last graph, we see the last two thousand years of temperature data. All of it except for the last 200 or so years worth is proxy data, which, I believe, has been 'smoothed' naturally in situ and then later smoothed by human manipulation. The black line is real-time data measured by modern instrumentation.
It bothers me to compare proxy data to instrumental data. The degree to which temperature varies across time, also bothers me. Today's temps don't really seem all that high compared to years before. It's very hard for me to understand how today's climate scientists are able to decouple AGW from natural GW.
Can an AGW proponent tell me what I'm missing?

Replies to this message:
 Message 43 by fgarb, posted 06-21-2009 2:55 PM roxrkool has not replied
 Message 45 by Nuggin, posted 06-21-2009 4:43 PM roxrkool has not replied

  
Newer Topic | Older Topic
Jump to:


Copyright 2001-2023 by EvC Forum, All Rights Reserved

™ Version 4.2
Innovative software from Qwixotic © 2024