Abby,
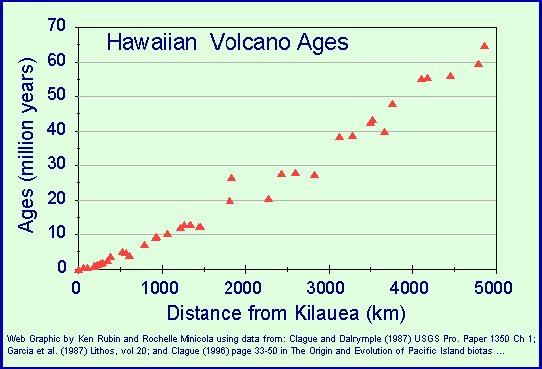
Couldn't help it, I had to make that graph. Instead of plotting 8.3 cm/yr I did a line of best fit (simple regression). I got an R
2=0.9826, and y=0.013x-2.7085. I obviously didn't force it through the origin, but the slope is 0.013 or 76.9 km/million years. This is pretty close to the 83 km/million years if current movement is extrapolated out. I would attach the excel file, but forum rules prohibit this. It only took me about 5 minutes to do it, so it shouldn't take long to reconstruct.
Also, I was hunting around for the actual measurements of the plate movement. I found this pic:
{Edited scaling, to restore page width to normal. Right click on graphic to see full scale version. - Adminnemooseus}
The measurements do differ between islands, anywhere from 6.4 to 8.5 cm/yr. So this could factor into the slop of the regression above.
If you right click on the pics you can get the source material, at least with most internet viewers.
[This message has been edited by Adminnemooseus, 03-18-2004]
[This message has been edited by Loudmouth, 03-19-2004]